forex:traderexpert

governed by ForexTraderExpert

forex:traderexpert

governed by ForexTraderExpert

forex:traderexpert

governed by ForexTraderExpert

forex:traderexpert

governed by ForexTraderExpert

forex:traderexpert

governed by ForexTraderExpert

Thursday, July 5, 2012

Forex: Fibo "the leading indicator"

I updated my trading based on fibo early this week.its work pretty awesome. I closed my trading with 130pips++. Eventhough i saw EU will go down further, i decided to closed my trade earlier. Because at H4, got strong support there around 1.2510. And not to forget this week got NFP. Yet still vote for EU to continue for bearish, hehe..
just my 2 cent. Fibo is the best leading indicator. believe with it.

Monday, July 2, 2012

Forex: Eur/Usd prediction for this week

According to my analysis based on Fibo, EU already completed retracement for downtrend and tomorrow will continue its journey to the south area a.k.a Bearish mode. The reason i said so because lime fibo(major fibo - bearish mode) already completed at area 78% which is strong resistant whereby mid term Fibo (blue-bullish trend) on last friday already projected to 78% bullish area after retrace from 38%. If you noticed, at that area, there is also 78% for main fibo (lime) provide very strong resistant for EU to overcome.So, in my opinion, its time for EU to resume its downtrend tomorrow.
-just my 2cent opinion.-

Thursday, June 28, 2012

Forex:SSRFV3 system

Today i found another system seems profitable to be used. I planned to share here in my blog. This system being used since 2010 if i'm not mistaken. The confounder for this system was master SSRFV.
This system used a combination of Fibo + stoch.
This is how this system look like:
The setting for Fibo in this system as followed:
0 = Low(%$)
0.236 = S1(%$)
0.786 = R1(%$)
0.382 = 38.2(%$)
0.5 = Buy / Sell(%$)
0.618 = 61.8(%$)
1 = High(%$)
1.382 = TP1(%$)
1.618 = TP2(%$)
-0.382 = TP1(%$)
-0.618 = TP2(%$)

stoch (5,3,3) + stoch (14,3,3) 

Dont worry if you dont know how to adjust setting of this system manually in your MT4, i will upload this system's template.

Lets focus on how this system working?
Did you noticed in the previous picture got white & yellow circle?
Those are the main area that we will focus whenever we want to start our trade.
Rule no. 1 ( FOR MANUAL SETTING )
This fibo based on daily CS. We started tu put fibo from the highest point to the lowest point of the previous day CS (regardless whether yesterday CS bullish or bearish).
For example:

Rule no.2
After setting up fibo on daily CS, switch TF to 15m TF.
Then your chart already can be used for trading. Simple isn't it?
Lets focus on the yellow & white circle in the picture above.
Those are the main area that we have to pay attention or in other word, those are the area where we will pull the trigger to enter the market.
3 area on Fibo:
  • High
  • Buy/Sell (pivot)
  • Low
2 area on stoch:
  • level 80
  • level 20
How or when do we enter the market?
  1. Whenever CS break and closed above (for buy signal) or below (for sell signal) one of these 3 fibo area.
  2. Both stoch in the level of 80 ( for buy signal) or level 20 ( for sell signal). 
 Example :

SSRFV3 system:
Download HERE!!..


Forex:Euro Treads Water Ahead of EU Summit

Euro continues to tread water as markets are awaiting the EU summit later this week. German Chancellor Merkel will meet with French President Hollande today in preparation of the two-day EU summit in Brussels on Thursday and Friday. Merkel was blunt in her rejection of Eurobonds and said yesterday that she doesn't see "total debt liability" as long as she lives. And, her spokesman Seibert reiterated today that "even within Germany after 60 years there isn't joint liability", and Merkel doesn't see it in Europe either. Yesterday, US rating agency cut Germany's rating to A+ from AA-.

Spanish Prime Minister Rajoy warned that the country "can't finance at current prices for too long" and there are institutions that have "no market access" in Spain, Italy and other countries. He said Spain is "going through a very difficult economic situation" and need "strong measures from Europe". Rajoy pledged to push for banking and fiscal union in this week's summit. Meanwhile, Economy Minister de Guindos said that EC President Van Rompuy's outline of banking union will be discussed at the summit.

Italian Prime Minister Monti won the first two of confidence votes yesterday on labour reforms. The final two votes are due today. Italy sold EUR 9b in 6-month bills today with up jumped to 2.96%, up from 2.10% in May's auction. Italian treasury will try to sell as much as EUR 5.5b in 5- and 10-year bonds tomorrow.

ECB said it allotted EUR 26.295b to banks in the region at its three-month refinancing operation. 50 banks bid for the funding, comparing to 33 participated in last operation in May. That's a slightly higher amount comparing to the EUR 25.13 b in three months funds maturing later this week. And, around EUR 1b of net rise in liquidity would be resulted. Meanwhile, there are speculations that since ECB won't restart the bond buying program, the central bank might opt for a rate cut next week.

On the data front, US durable goods orders rose more than expected by 1.1% in May while ex-transport orders rose 0.4%. Germany CPI dropped -0.1% mom in June and moderated to 1.8% yoy. UK BBA mortgage approvals dropped to 30.2k in May while CPI reported sales improved to 42 in June. New Zealand trade surplus came in at NZD 301m in May, inline with expectation.
(actionforex.com)

Tuesday, June 26, 2012

Forex: EUR/USD Mid-Day Outlook

EUR/USD dips further today but is still holding above 1.2435 minor support and intraday bias remains neutral. With 1.2435 intact, corrective rebound from 1.2287 could still extend higher. Above 1.2530 minor resistance will flip bias back to the upside for 1.2747 and then 61.8% retracement of 1.3282 to 1.2287 at 1.2902. Though, break of 1.2435 will indicate that such corrective rise is already completed and will flip bias back to the downside for 1.2287 and below.
In the bigger picture, fall from 1.4939 is treated as a falling leg inside the consolidation pattern that started at 1.6039 (2008 high) and could extend to 1.1875 low and below. In that case, though, strong support is expected from 1.1639/1875 support zone to contain downside and bring rebound. After all, such consolidation would extend further inside range of 1.1639/6039 for some more time. On the upside, break of 1.3486 resistance is needed to indicate completion of fall from 1.4939. Otherwise, outlook will stay bearish even in case of strong rebound.

Daily Pivots: (S1) 1.2463; (P) 1.2511 (R1) 1.2551


Forex: Euro Tumbles on Fresh Selling after Spain Bill Auctions

Fresh selling is seen in Euro today after Spain bill auctions ended with sharply higher yield while there is growing pessimism that the EU summit later this week will conclude with any substantive actions. Spain sold EUR 1.6b of 3-month bills with yield at 2.362%, nearly tripped 0.846% yield at an auction in May. The treasury also so EUR 1.48b of 6-month bills with yield at 3.237%, also nearly doubled 1.737% in another auction in May. Nonetheless, the combined EUR 3.08b sale exceeded its EUR 2-3b target, suggesting that demand was still there. Meanwhile, Italy sold EUR 2.99b of zero-coupon notes due in May 2014 with yield at 4.71%, higher than late 4.04% at May's auction. Italy also successfully sold EUR 0.92b of inflation linked debt.

EU President Van Rompuy released his grand vision 10 year road map on banking supervision and deposit insurance today. The report was a collaboration effort with ECB president Draghi, EC President Barroso and head of EU finance ministers Juncker. The report envisaged that regional banking supervision will be entrusted to ECB and a regional deposit insurance program will be implemented to strengthen credibility of current national backstops. But regarding joint debts, the report noted that "a robust framework for budgetary discipline and competitiveness" needs to be in place before considering introduction of "joint and several sovereign liabilities".

German Deputy Foreign Minister Link criticized that "parts of it read like a wish list," and is short of "improved controls". German Chancellor hardened her stance on Euro bonds ahead of the EU summit on June 28-29. Merkel said that "Euro bonds, Euro bills and European deposit insurance with joint liability and much more" was "economically wrong and counterproductive". Moreover, she openly stated that the upcoming summit "will be far too much about all kinds of ideas for joint liability and far too little about improved oversight and structural measures....So the goal has to be a political union in which the standard is whatever the best, not mediocrity is". These comments suggested that Merkel continued to oppose the ideas of joint Euro bonds. While this does not mean that she will not accept such as move even though the market situation deteriorates markedly further, the terms and conditions of any joint issuance would likely be under Germany's ruling.

In Greece, Prime Minister Samaras quickly named Athens University economics professor Yannis Stournaras as finance minister after Vassilis Rapanos quitted on Monday on health issue. Samaras, who underwent an eye surgery over the weekend, is set to miss this week's EU summit while it's also unclear whether Stournaras would join. Outgoing finance minister Zanias will represent Greece instead. And it's also uncertain when troika will return to Greece for review.

BoE officials addressed parliament's Treasury Committee today. Governor King said that the MPC is united on the need for a "very loose monetary policy" but views diverged on "precisely how loose it should be". He noted that the bank could do more on asset purchases and there is "no immediate limit or constrain" on that. But King would prefer to see how the situation plays out first. Meanwhile, King also said he's "pessimistic" and concerned about Eurozone as situation get worse over two years.

The lower house of the Japanese parliament passed the bill to double the consumption tax in three years by a vote of 363-96. The bill will then be voted by the upper house to become law and it's very likely to be approved. The consumption tax hike was a means to ease the fiscal deficit of the Japanese economy. However, the impact is expected to be small. While the government anticipates it would help soothe the fiscal problems, opposition parties believed this would weaken demand for domestic goods, further hurting the nation's economy. Some analysts viewed that the hike would weaken that outlook of Japanese yen. On the political front, opponents of the tax hike may submit a no-confidence motion regarding the bill. The worst scenario would be resignation of the Noda Cabinet or dissolution of the lower house and elections.
(actionforex.com)

Forex: Euro Soft as Spanish Banks Downgraded Again, Cyrus Sought Bailout

Euro remains broadly soft as continued to be weighed down by negative news flow from Eurozone. Spain formally requested for bailout for its banks yesterday and is expecting to finish the MOU before EcoFin meeting in early July. The bank bailout program agreed earlier this month could give Spanish banks a lifeline of as much as EUR 100b and it's estimated it may take as much as EUR 62b in the worst case scenario European Union Economic and Monetary Affairs Commissioner Olli Rehn emphasized that "Restructuring the banking sector is key to reinforce the confidence in the Spanish economy and to restore the conditions to proper access to credit by companies and households, thus for sustaining the recovery".
Shortly after Spain's formal request for bailing out its banking sector, Moody's reduced long-term debt and deposit ratings for 28 Spanish banks and two issuer ratings. That include a cut to Banco Santander's long-term rating to Baa2 from A3 and Banco Bilbao Vizcaya Argentaria SA to Baa3 from A3. Both are Spain's largest lenders and are placed not far from junk level. Overall, over a dozen of Spanish banks were downgrade to junk status and Moody's had indeed downgraded six banks by four notches and ten by three. According to the rating agency, these banks have a link to Spain's creditworthiness which has deteriorated and will affect the "credit profile for Spanish banks".
Meanwhile, it's reported that Cyprus has asked for financial assistance from the EU/IMF to save its banks, making it the firth country in the bloc that needed bailout. Yet, the amount and terms will still need negotiation in coming days. It's expected that the required fund will range from EUR 5-10b, compared with EUR 100b required by Spain.
On the other hand, German Chancellor hardened her stance on Euro bonds ahead of the EU summit on June 28-29. Merkel said that "Euro bonds, Euro bills and European deposit insurance with joint liability and much more" was "economically wrong and counterproductive". Moreover, she openly stated that the upcoming summit "will be far too much about all kinds of ideas for joint liability and far too little about improved oversight and structural measures....So the goal has to be a political union in which the standard is whatever the best, not mediocrity is". These comments suggested that Merkel continued to oppose the ideas of joint Euro bonds. While this does not mean that she will not accept such as move even though the market situation deteriorates markedly further, the terms and conditions of any joint issuance would likely be under Germany's ruling.
In US, Richmond Fed Lacker said that monetary policy "doesn't have a lot of capability right now" to boost growth. He said that further stimulus at this point would "most likely just raise inflation". And, Lacker warned that there is a "significant fiscal adjustment" ahead that could have "a demonstrable effect on growth", referring to the so called "fiscal cliff". On the other hand, BoE miles said yesterday that UK needs a "more expansionary monetary policy", with "substantial change in asset purchases".
On the dataflow, Germany's Gfk consumer sentiment probably slipped -0.1 point to 5.6 in July. In the US, consumer confidence might have dropped -0.9 points to 64 in June while S&P/Case-Shiller composite-20 index might have contracted -2.05 y/y in April after a -2.6% drop in the prior month.
(actionforex.com)

Friday, June 22, 2012

Forex:Harami

The Harami (meaning "pregnant" in Japanese) Candlestick Pattern is a reversal pattern.
The pattern consists of two Candlesticks:
  1. Larger Bullish or Bearish Candle (Day 1) 
  2. Smaller Bullish or Bearish Candle (Day 2)  

The Harami Pattern is considered either bullish or bearish based on the criteria below: Bearish Harami: A bearish Harami occurs when there is a large bullish green candle on Day 1 followed by a smaller bearish or bullish candle on Day 2. The most important aspect of the bearish Harami is that prices gapped down on Day 2 and were unable to move higher back to the close of Day 1. This is a sign that uncertainty is entering the market. Bullish Harami: A bullish Harami occurs when there is a large bearish red candle on Day 1 followed by a smaller bearish or bullish candle on Day 2. Again, the most important aspect of the bullish Harami is that prices gapped up on Day 2 and price was held up and unable to move lower back to the bearish close of Day 1.
The chart below shows an example of both a bullish and bearish Harami candlestick pattern:


Order a schadenfreude movie on DVD now!

Forex: Morning Star

The Morning Star Pattern is a bearish reversal pattern, usually occuring at the bottom of a downtrend.
The pattern consists of three candlesticks:
  1. Large Bearish Candle (Day 1) 
  2. Small Bullish or Bearish Candle (Day 2) 
  3.  Large Bullish Candle (Day 3)  
The first part of a Morning Star reversal pattern is a large bearish red candle. On the first day, bears are definitely in charge, usually making new lows. The second day begins with a bearish gap down. It is clear from the opening of Day 2 that bears are in control. However, bears do not push prices much lower. The candlestick on Day 2 is quite small and can be bullish, bearish, or neutral (i.e. Doji). Generally speaking, a bullish candle on Day 2 is a stronger sign of an impending reversal. But it is Day 3 that holds the most significance. Day 3 begins with a bullish gap up, and bulls are able to press prices even further upward, often eliminating the losses seen on Day 1.

The chart below shows an example a Morning Star bullish reversal pattern that occured at the end of a downtrend:
Day 1 of the Morning Star pattern for the chart above was a strong bearish red candle. Day 2 continued Day 1's bearish sentiment by gapping down. However, Day 2 was a Doji, which is a candlestick signifying indecision. Bears were unable to continue the large decreases of the previous day; they were only able to close slightly lower than the open.

Day 3 began with a bullish gap up. The bulls then took hold for the entire day. Also, Day 3 broke above the downward trendline that had served as resistance for the past week and a half. Both the trendline break and the classic Morning Star pattern gave traders a signal to go long.

The Morning Star pattern is a very powerful three candlestick bullish reversal pattern. The bearish equivalent of the Morning Star is the Evening Star pattern.

Forex: Shooting Star

The Shooting Star candlestick formation is a significant bearish reversal candlestick pattern that mainly occurs at the top of uptrends.
The Shooting formation is created when the open, low, and close are roughly the same price. Also, there is a long upper shadow, generally defined as at least twice the length of the real body. When the low and the close are the same, a bearish Shooting Star candlestick is formed and it is considered a stronger formation because the bears were able to reject the bulls completely plus the bears were able to push prices even more by closing below the opening price. The Shooting Star formation is considered less bearish, but nevertheless bearish when the open and low are roughly the same. The bears were able to counteract the bulls, but were not able to bring the price back to the price at the open. The long upper shadow of the Shooting Star implies that the market tested to find where resistance and supply was located. When the market found the area of resistance, the highs of the day, bears began to push prices lower, ending the day near the opening price. Thus, the bullish advance upward was rejected by the bears.

The chart below illustrates a Shooting Star reversal pattern after an uptrend:

In the chart above, the market began the day testing to find where supply would enter the market. Price eventually found resistance at the high of the day. In fact, there was so much resistance and subsequent selling pressure, that prices were able to close the day significantly lower than the open, a very bearish sign.

The Shooting Star is an extremely helpful candlestick pattern to help traders visually see where resistance and supply is located. After an uptrend, the Shooting Star pattern can signal to traders that the uptrend could be over and that long positions should probably be reduced or completely exited.

However, other indicators should be used in conjunction with the Shooting Star candlestick pattern to determine sell signals, for example, waiting a day to see if prices continued falling or other chart indications such as a break of an upward trendline.

 For aggressive traders, the Shooting Star pattern illustrated above could be used as the sell signal. The red portion of the candle (the difference between the open and close) was so large, that it could be considered the same as a bearish candle occuring on the next day. However, caution would have to be used because the close of the Shooting Star rested right at the uptrend support line.

Generally speaking though, a trader should wait for a confirmation candle before entering. The bullish version of the Shooting Star formation is the Inverted Hammer formation that occurs at bottoms. Another similar candlestick pattern in look and interpretation to the Shooting Star pattern is the Gravestone Doji.

Forex: Doji

The Doji is a powerful Candlestick formation, signifying indecision between bulls and bears. A Doji is quite often found at the bottom and top of trends and thus is considered as a sign of possible reversal of price direction, but the Doji can be viewed as a continuation pattern as well.
A Doji is formed when the opening price and the closing price are equal. A long-legged Doji, often called a "Rickshaw Man" is the same as a Doji, except the upper and lower shadows are much longer than the regular Doji formation. The creation of the Doji pattern illustrates why the Doji represents such indecision. After the open, bulls push prices higher only for prices to be rejected and pushed lower by the bears. However, bears are unable to keep prices lower, and bulls then push prices back to the opening price. Of course, a Doji could be formed by prices moving lower first and then higher second, nevertheless, either way, the market closes back where the day started.

The chart below shows two examples of Doji's:

Forex: Bullish Engulfing Pattern

Bullish Engulfing Pattern 
The Bullish Engulfing Candlestick Pattern is a bullish reversal pattern, usually occuring at the bottom of a downtrend.
The pattern consists of two Candlesticks:
  1. Smaller Bearish Candle (Day 1) 
  2. Larger Bullish Candle (Day 2)  
The bearish candle real body of Day 1 is usually contained within the real body of the bullish candle of Day 2. On Day 2, the market gaps down; however, the bears do not get very far before bulls take over and push prices higher, filling in the gap down from the morning's open and pushing prices past the previous day's open. The power of the Bullish Engulfing Pattern comes from the incredible change of sentiment from a bearish gap down in the morning, to a large bullish real body candle that closes at the highs of the day. Bears have overstayed their welcome and bulls have taken control of the market.

The chart below shows an example of a Bullish Engulfing Pattern occuring at the end of a downtrend:

Forex:Bearish Engulfing Pattern

Bearish Engulfing Pattern 
The Bearish Engulfing Candlestick Pattern is a bearish reversal pattern, usually occuring at the top of an uptrend.
The pattern consists of two Candlesticks:
  1. Smaller Bullish Candle (Day 1)
  2.  Larger Bearish Candle (Day 2) 

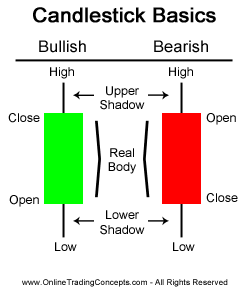
Generally, the bullish candle real body of Day 1 is contained within the real body of the bearish candle of Day 2. The market gaps up (bullish sign) on Day 2; but, the bulls do not push very far higher before bears take over and push prices further down, not only filling in the gap down from the morning's open but also pushing prices below the previous day's open. With the Bullish Engulfing Pattern, there is an incredible change of sentiment from the bullish gap up at the open, to the large bearish real body candle that closed at the lows of the day. Bears have successfully overtaken bulls for the day and possibly for the next few periods.


The chart below shows an example two Bearish Engulfing Patterns occuring at the end of uptrends:

Forex: Candlestick Patterns

Candlestick Basics
Candlestick charts are an effective way of visualizing price movements.
There are two basic candlesticks:
Bullish Candle: When the close is higher than the open (usually green or white)
Bearish Candle: When the close is lower than the open (usually red or black)

Candlestick Parts
There are three main parts to a candlestick:
Upper Shadow: The vertical line between the high of the day and the close (bullish candle) or open (bearish candle) Real Body: The difference between the open and close; colored portion of the candlestick
Lower Shadow: The vertical line between the low of the day and the open (bullish candle) or close (bearish candle)


Thursday, June 21, 2012

Forex: Dollar Trying to Recover after FOMC and China PMI

After some volatility overnight, dollar seems to be gathering some momentum against other currencies in Asian session. Markets were somewhat disappointed by Fed's announcement to expand the Operation Twist Program by $267b. But there sentiments were lifted by German Chancellor's comment on the possibility of using European bailout funds to purchase Spain and Italian debts. Then but Asian markets were then back under pressure after China's manufacturing data. Asian equities are broadly lower at the time of writing and overall sentiments dragged down Aussie and loonie lower. Meanwhile, note that Euro's rebound against dollar overnight was relatively weak as EUR/USD was limited below 1.2747 high of the week, set on Monday. The common currency will face tests of Spain auction and Eurozone PMIs later today and will remain vulnerable. As we had anticipated, the Fed decided to extend operation twist through the year-end, instead of implementation of QE3, in June. With the amount of $267B, the pace of asset purchases and sales would remain unchanged. To our surprise but indeed a positive sign, the Fed maintain the reference of keeping interest rates at exceptionally low level at least through late 2014, rather than delaying the timing of the first rate hike. Economic forecasts were markedly downgraded. The Fed retained the possibility of further easing but this would depend on the job market situation. There were 2 additional members at the meeting, Governors Jeremy Stein and Jerome Powell, present at the meeting. German Chancellor Merkel said that while there is "no concrete planning", there is "possibility" of buying sovereign bonds on the secondary markets. Nonetheless, she clarified it's a "purely theoretical statement about the legal situation" and is "not up for debate" for the moment. Greece's political impasse ended on Wednesday as New Democracy leader Samaras was sworn in as the fourth prime minister in eight months. All three coalition parties, including Pasok and Democratic Left, backed further austerity but will also push for negotiation of better bailout terms. Former finance minister Venizelos said that the June 28-29 EU summit will be the "first big battle on the revision of the bailout agreement, the creation of a framework that will allow us to move to positive growth and to combat unemployment, which is the big problem of Greek society". In Spain, firstly, treasury will auction EUR 2-3b of bonds due in 2014, 2015 and 2017 today. Secondly, independent audit of the countries' banks will be due today and should help Spain decide how much of the EUR 100b bailout fund is needed for the banking sector. Spanish 10 year yield has retreated back to around 6.7/8% yesterday, after making an euro era record of above 7%. In China, the preliminary HSBC manufacturing PMI index dropped for another month to 48.1 in June. That's the eight straight month that the index stays in contraction region below 50 and matched the streak during 2008 financial crisis. Note that the new export orders sub-index dived to 45.9, lowest level since 2009. Some analysts criticized that China's easing policy so far was no enough and urged the government to do more to stabilize the slowdown. On the data front, New Zealand GDP showed 1.1% qoq growth in Q1, beat expectation of 0.4% qoq. Eurozone PMIs will be a focus today together with UK retail sales. In US session, Canadian retail sales, US jobless claims, Philly fed survey, house price index and leading indicators will be released.

Wednesday, June 20, 2012

Forex: GBP/JPY Daily Outlook

GBP/JPY is stuck in tight range of 122.12/124.64 and intraday bias remains neutral for the moment. On the downside, break of 122.12 support will indicate that the corrective rebound from 118.82 has completed and will flip bias back to the downside for retesting 118.82 low. On the upside, above 124.64 will in turn extend the rebound from 118.82 towards 127.10 support. In the bigger picture, the corrective structure of the rebound from 116.83 to 133.48 indicates that down trend from 2007 high of 251.09 is not finished yet. Break of 116.83 will resume such down trend and target 110 psychological level first. Break will pave the way to the more important 100 level and possibly below. On the upside, however, above 127.01 will firstly indicate that fall from 133.48 is finished. Further, break of 133.48 should then confirm medium termreversal.

Tuesday, June 19, 2012

Forex:GBP/JPY Daily Outlook

GBP/JPY jumps sharply higher today and the break of 124.34 suggests that rebound form 118.82 has resumed. Intraday bias is back on the upside and break of 124.64 resistance will target 127.10 support turned resistance next. On the downside, break of 122.12 support, however, will indicate that the corrective rebound from 118.82 has completed and will flip bias back to the downside for retesting 118.82 low instead. In the bigger picture, the corrective structure of the rebound from 116.83 to 133.48 indicates that down trend from 2007 high of 251.09 is not finished yet. Break of 116.83 will resume such down trend and target 110 psychological level first. Break will pave the way to the more important 100 level and possibly below. On the upside, however, above 127.01 will firstly indicate that fall from 133.48 is finished. Further, break of 133.48 should then confirm medium term reversal.

Wednesday, March 14, 2012

EU 13/2/12 cornflower

today on EU, i've decided to go for short..hehe..

Reason for Short:
1)all MA crossed & ponting downward
2)stoch: pointing downward
3)MACD: crossed downward below 0
4)Price rejected at weekly pivot..

post closed with profit..hehe

Friday, March 9, 2012

NFP march 2012

my prediction with CORNFLOWER was pretty well.EU in BEARISH mode..hehe

Reason for bearish: H1,H4 & D1 are in bearish mode..& CORNFLOWER H1 signal for bearish.
my target is at Weekly S1 @ 1.3095

Tuesday, March 6, 2012

coRnflower Technique

this my new system that i used for my trading..looks super awesome!!!


These are the rules:

Best Time Frame: H1
Intraday : M30 (TP:20-40 SL:30)
Long Term (2 days until 2 weeks) :H1 :TP up to you..hehe

Indictor used in this system:
• EMA 8 EMA (YELLOW)
• EMA 12 EMA (VIOLET)
• EMA 24 (CORNFLOWER BLUE)
• EMA 72 (KHAKI)
MACD (12, 26, 9)
RSI (14) > 50 BUY, if < 50 SELL. How to enter market?: When EMA 8 & EMA 12 move across EMA 24; while EMA 8, 12 & 24 move above EMA 72. OR when EMA 8, 12, 24 cross above EMA 72. at the same time,Chek RSI (14) should >50 & MACD crosses.

Vice versa for sell.
simple right??hehe

Share

Twitter Delicious Facebook Digg Stumbleupon Favorites More