forex:traderexpert

governed by ForexTraderExpert

Thursday, June 28, 2012

Forex:SSRFV3 system

Today i found another system seems profitable to be used. I planned to share here in my blog. This system being used since 2010 if i'm not mistaken. The confounder for this system was master SSRFV. This system used a combination of Fibo + stoch. This is how this system look like: The setting for Fibo in this system as followed: 0 = Low(%$) 0.236 = S1(%$) 0.786 = R1(%$) 0.382 = 38.2(%$) 0.5 = Buy / Sell(%$) 0.618 = 61.8(%$) 1 = High(%$) 1.382 = TP1(%$) 1.618 = TP2(%$) -0.382 = TP1(%$) -0.618 = TP2(%$) stoch (5,3,3) + stoch (14,3,3)  Dont worry if you dont know how to adjust setting of this system manually in your MT4, i...

Forex:Euro Treads Water Ahead of EU Summit

Euro continues to tread water as markets are awaiting the EU summit later this week. German Chancellor Merkel will meet with French President Hollande today in preparation of the two-day EU summit in Brussels on Thursday and Friday. Merkel was blunt in her rejection of Eurobonds and said yesterday that she doesn't see "total debt liability" as long as she lives. And, her spokesman Seibert reiterated today that "even within Germany after 60 years there isn't joint liability", and Merkel doesn't see it in Europe either. Yesterday, US rating agency cut Germany's rating to A+ from AA-. Spanish Prime Minister Rajoy warned that the country "can't finance at current prices for too long" and there are institutions that have "no market access" in Spain, Italy and other countries. He said...

Tuesday, June 26, 2012

Forex: EUR/USD Mid-Day Outlook

EUR/USD dips further today but is still holding above 1.2435 minor support and intraday bias remains neutral. With 1.2435 intact, corrective rebound from 1.2287 could still extend higher. Above 1.2530 minor resistance will flip bias back to the upside for 1.2747 and then 61.8% retracement of 1.3282 to 1.2287 at 1.2902. Though, break of 1.2435 will indicate that such corrective rise is already completed and will flip bias back to the downside for 1.2287 and below. In the bigger picture, fall from 1.4939 is treated as a falling leg inside the consolidation pattern that started at 1.6039 (2008 high) and could extend to 1.1875 low and below....

Forex: Euro Tumbles on Fresh Selling after Spain Bill Auctions

Fresh selling is seen in Euro today after Spain bill auctions ended with sharply higher yield while there is growing pessimism that the EU summit later this week will conclude with any substantive actions. Spain sold EUR 1.6b of 3-month bills with yield at 2.362%, nearly tripped 0.846% yield at an auction in May. The treasury also so EUR 1.48b of 6-month bills with yield at 3.237%, also nearly doubled 1.737% in another auction in May. Nonetheless, the combined EUR 3.08b sale exceeded its EUR 2-3b target, suggesting that demand was still there. Meanwhile, Italy sold EUR 2.99b of zero-coupon notes due in May 2014 with yield at 4.71%, higher than late 4.04% at May's auction. Italy also successfully sold EUR 0.92b of inflation linked debt. EU President Van Rompuy released his grand...

Forex: Euro Soft as Spanish Banks Downgraded Again, Cyrus Sought Bailout

Euro remains broadly soft as continued to be weighed down by negative news flow from Eurozone. Spain formally requested for bailout for its banks yesterday and is expecting to finish the MOU before EcoFin meeting in early July. The bank bailout program agreed earlier this month could give Spanish banks a lifeline of as much as EUR 100b and it's estimated it may take as much as EUR 62b in the worst case scenario European Union Economic and Monetary Affairs Commissioner Olli Rehn emphasized that "Restructuring the banking sector is key to reinforce the confidence in the Spanish economy and to restore the conditions to proper access to credit by companies and households, thus for sustaining the recovery". Shortly after Spain's formal request for bailing out its banking sector, Moody's...

Friday, June 22, 2012

Forex:Harami

The Harami (meaning "pregnant" in Japanese) Candlestick Pattern is a reversal pattern. The pattern consists of two Candlesticks: Larger Bullish or Bearish Candle (Day 1)  Smaller Bullish or Bearish Candle (Day 2)   The Harami Pattern is considered either bullish or bearish based on the criteria below: Bearish Harami: A bearish Harami occurs when there is a large bullish green candle on Day 1 followed by a smaller bearish or bullish candle on Day 2. The most important aspect of the bearish Harami is that prices gapped down on Day 2 and were unable to move higher back to the close of Day 1. This is a sign that uncertainty is entering...

Forex: Morning Star

The Morning Star Pattern is a bearish reversal pattern, usually occuring at the bottom of a downtrend. The pattern consists of three candlesticks: Large Bearish Candle (Day 1)  Small Bullish or Bearish Candle (Day 2)   Large Bullish Candle (Day 3)   The first part of a Morning Star reversal pattern is a large bearish red candle. On the first day, bears are definitely in charge, usually making new lows. The second day begins with a bearish gap down. It is clear from the opening of Day 2 that bears are in control. However, bears do not push prices much lower. The candlestick on Day 2 is quite small and can be bullish, bearish,...

Forex: Shooting Star

The Shooting Star candlestick formation is a significant bearish reversal candlestick pattern that mainly occurs at the top of uptrends. The Shooting formation is created when the open, low, and close are roughly the same price. Also, there is a long upper shadow, generally defined as at least twice the length of the real body. When the low and the close are the same, a bearish Shooting Star candlestick is formed and it is considered a stronger formation because the bears were able to reject the bulls completely plus the bears were able to push prices even more by closing below the opening price. The Shooting Star formation is considered less...

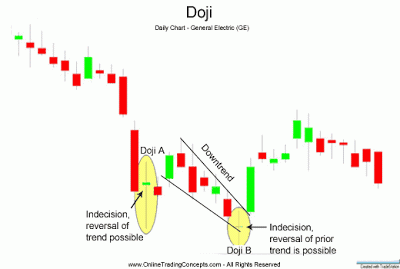
Forex: Doji

The Doji is a powerful Candlestick formation, signifying indecision between bulls and bears. A Doji is quite often found at the bottom and top of trends and thus is considered as a sign of possible reversal of price direction, but the Doji can be viewed as a continuation pattern as well. A Doji is formed when the opening price and the closing price are equal. A long-legged Doji, often called a "Rickshaw Man" is the same as a Doji, except the upper and lower shadows are much longer than the regular Doji formation. The creation of the Doji pattern illustrates why the Doji represents such indecision. After the open, bulls push prices higher only...

Forex: Bullish Engulfing Pattern

Bullish Engulfing Pattern  The Bullish Engulfing Candlestick Pattern is a bullish reversal pattern, usually occuring at the bottom of a downtrend. The pattern consists of two Candlesticks: Smaller Bearish Candle (Day 1)  Larger Bullish Candle (Day 2)   The bearish candle real body of Day 1 is usually contained within the real body of the bullish candle of Day 2. On Day 2, the market gaps down; however, the bears do not get very far before bulls take over and push prices higher, filling in the gap down from the morning's open and pushing prices past the previous day's open. The power of the Bullish Engulfing Pattern comes from...

Forex:Bearish Engulfing Pattern

Bearish Engulfing Pattern  The Bearish Engulfing Candlestick Pattern is a bearish reversal pattern, usually occuring at the top of an uptrend. The pattern consists of two Candlesticks: Smaller Bullish Candle (Day 1)  Larger Bearish Candle (Day 2)  Generally, the bullish candle real body of Day 1 is contained within the real body of the bearish candle of Day 2. The market gaps up (bullish sign) on Day 2; but, the bulls do not push very far higher before bears take over and push prices further down, not only filling in the gap down from the morning's open but also pushing prices below the previous day's open. With the Bullish...

Forex: Candlestick Patterns

Candlestick Basics Candlestick charts are an effective way of visualizing price movements. There are two basic candlesticks: Bullish Candle: When the close is higher than the open (usually green or white) Bearish Candle: When the close is lower than the open (usually red or black) Candlestick Parts There are three main parts to a candlestick: Upper Shadow: The vertical line between the high of the day and the close (bullish candle) or open (bearish candle) Real Body: The difference between the open and close; colored portion of the candlestick Lower Shadow: The vertical line between the low of the day and the open (bullish candle) or close...

Thursday, June 21, 2012

Forex: Dollar Trying to Recover after FOMC and China PMI

After some volatility overnight, dollar seems to be gathering some momentum against other currencies in Asian session. Markets were somewhat disappointed by Fed's announcement to expand the Operation Twist Program by $267b. But there sentiments were lifted by German Chancellor's comment on the possibility of using European bailout funds to purchase Spain and Italian debts. Then but Asian markets were then back under pressure after China's manufacturing data. Asian equities are broadly lower at the time of writing and overall sentiments dragged down Aussie and loonie lower. Meanwhile, note that Euro's rebound against dollar overnight was relatively weak as EUR/USD was limited below 1.2747 high of the week, set on Monday. The common currency will face tests of Spain auction and Eurozone PMIs...

Wednesday, June 20, 2012

Forex: GBP/JPY Daily Outlook

GBP/JPY is stuck in tight range of 122.12/124.64 and intraday bias remains neutral for the moment. On the downside, break of 122.12 support will indicate that the corrective rebound from 118.82 has completed and will flip bias back to the downside for retesting 118.82 low. On the upside, above 124.64 will in turn extend the rebound from 118.82 towards 127.10 support. In the bigger picture, the corrective structure of the rebound from 116.83 to 133.48 indicates that down trend from 2007 high of 251.09 is not finished yet. Break of 116.83 will resume such down trend and target 110 psychological level first. Break will pave the way to the more...

Tuesday, June 19, 2012

Forex:GBP/JPY Daily Outlook

GBP/JPY jumps sharply higher today and the break of 124.34 suggests that rebound form 118.82 has resumed. Intraday bias is back on the upside and break of 124.64 resistance will target 127.10 support turned resistance next. On the downside, break of 122.12 support, however, will indicate that the corrective rebound from 118.82 has completed and will flip bias back to the downside for retesting 118.82 low instead. In the bigger picture, the corrective structure of the rebound from 116.83 to 133.48 indicates that down trend from 2007 high of 251.09 is not finished yet. Break of 116.83 will resume such down trend and target 110 psychological level...

Pages 141234 »

Share

Twitter Delicious Facebook Digg Stumbleupon Favorites More